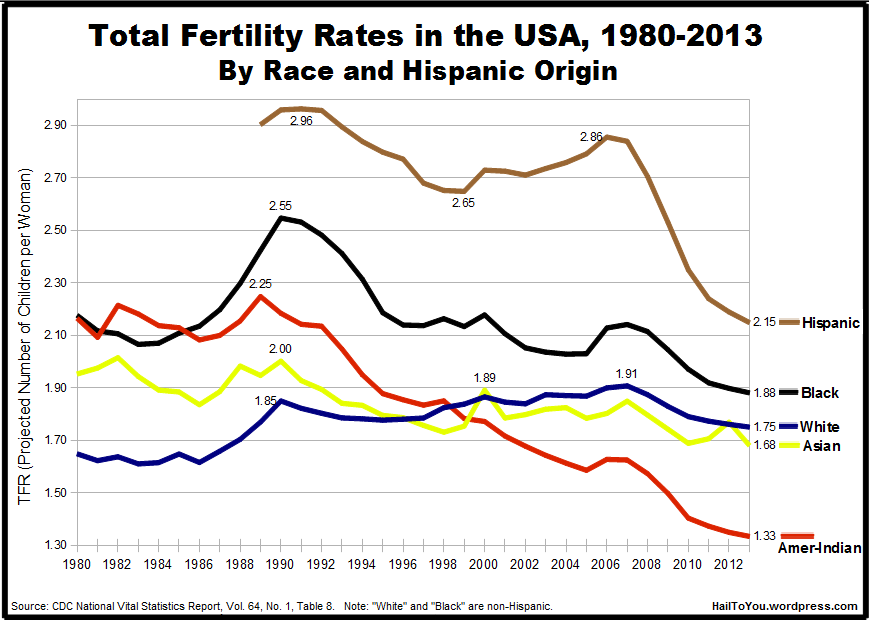
We all know that the U.S. and Europe are experiencing declining birth rates. But I was struck by the MAGNITUDE of the U.S. drop since 2007. As the accompanying chart shows, it’s dropped for every race, though most dramatically for the Hispanic population. More important, we’re now below the “replacement level fertility” level.
The “Replacement level fertility” is the total fertility rate—the average number of children born per woman—at which a population exactly replaces itself from one generation to the next, without migration. This rate is roughly 2.1 children per woman for most [developed] countries . . . .
http://www.wri.org/publication/achieving-replacement-level-fertility
Reasons vary for this drop in fertility rate. Surely better birth control options are a factor. And fewer choosing marriage and child rearing as an option. But the latest (post 2007) drop might be more related to a growing pessimism about the future prospects for a family (and for our nation).
I also was struck by the narrowing of birth rates among the races. Yes, Hispanics and blacks procreate at a somewhat higher rate than Asians and whites, but the differences have substantially lessened.
This birth rate drop is good news in some sense, and bad news in others. But the one thing that jumps out at me is that it makes the case for allowing immigration — especially of people who come to work. I don’t agree with those who want to end immigration. I like a reasonable number of vetted immigrants coming here (as long as they are not Muslim). And my definition of “reasonable number” is higher than my conservative friends, though still a nebulous figure.
https://hailtoyou.wordpress.com/2015/12/21/total-fertility-rates-by-race-in-the-usa-1980-2013/
Total Fertility Rates by Race in the USA, 1980-2013
Posted on December 21, 2015
by Hail
I present the latest data on U.S. Total Fertility rates by race through 2013. (Data source links at the end of this post.) You can see herein the full effect of the George W. Bush Housing Bubble in its historical context:
_________________________________________________
The actual number of births in 2013:
- 2,130,000 babies born to White Non-Hispanic women (54.1%).
- 580,000 babies born to Black Non-Hispanic women (14.8%).
- 900,000 babies born to Hispanic women (22.9%).
- 270,000 babies born to Asian women (6.8%).
- 46,000 babies born to American-Indian women (1.2%).
_________________________________________________
TFRs for the entire period 1980-2013:
1.97 — Overall USA
1.77 — White non-Hispanic (=child generation is 84% as large as parent generation)
2.16 — Black (=child generation is 103% as large as parents’)
2.70 — Hispanic (’89-’13 only) (=child generation is 129% as large as parents’)
1.84 — Asian (=child generation is 88% as large as parents’)
1.85 — American-Indian (=child generation is 88% as large as parents’)
Note: The size of the child generation is here based on a replacement fertility of exactly 2.10.
______________________________________________


